Periodic data can be defined only in one period and be extended to any arbitrary range.
WrapCircular(x, circular = "lon", wrap = c(0, 360))Arguments
- x
a data.frame
- circular
the name of the circular dimension
- wrap
the wrap for the data to be extended to
Value
A data.frame.
See also
geom_contour2
Other ggplot2 helpers:
DivideTimeseries(),
MakeBreaks(),
geom_arrow(),
geom_contour2(),
geom_contour_fill(),
geom_label_contour(),
geom_relief(),
geom_streamline(),
guide_colourstrip(),
map_labels,
reverselog_trans(),
scale_divergent,
scale_longitude,
stat_na(),
stat_subset()
Examples
library(ggplot2)
library(data.table)
data(geopotential)
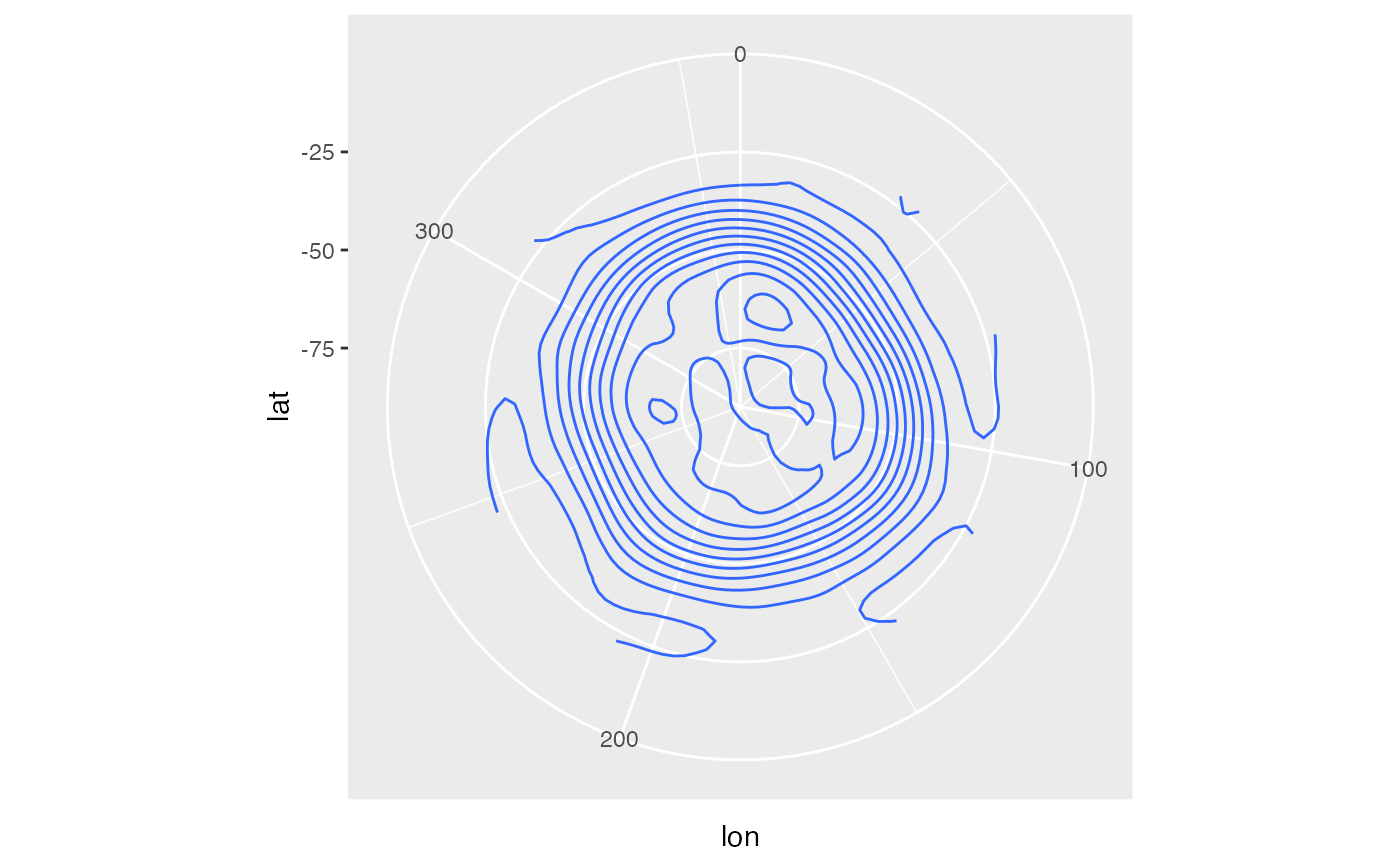
g <- ggplot(geopotential[date == date[1]], aes(lon, lat)) +
geom_contour(aes(z = gh)) +
coord_polar() +
ylim(c(-90, -10))
# This plot has problems in lon = 0
g
 # But using WrapCircular solves it.
g %+% WrapCircular(geopotential[date == date[1]], "lon", c(0, 360))
#> Warning: 'WrapCircular' is deprecated, use ggperiodic::wrap instead.
# But using WrapCircular solves it.
g %+% WrapCircular(geopotential[date == date[1]], "lon", c(0, 360))
#> Warning: 'WrapCircular' is deprecated, use ggperiodic::wrap instead.
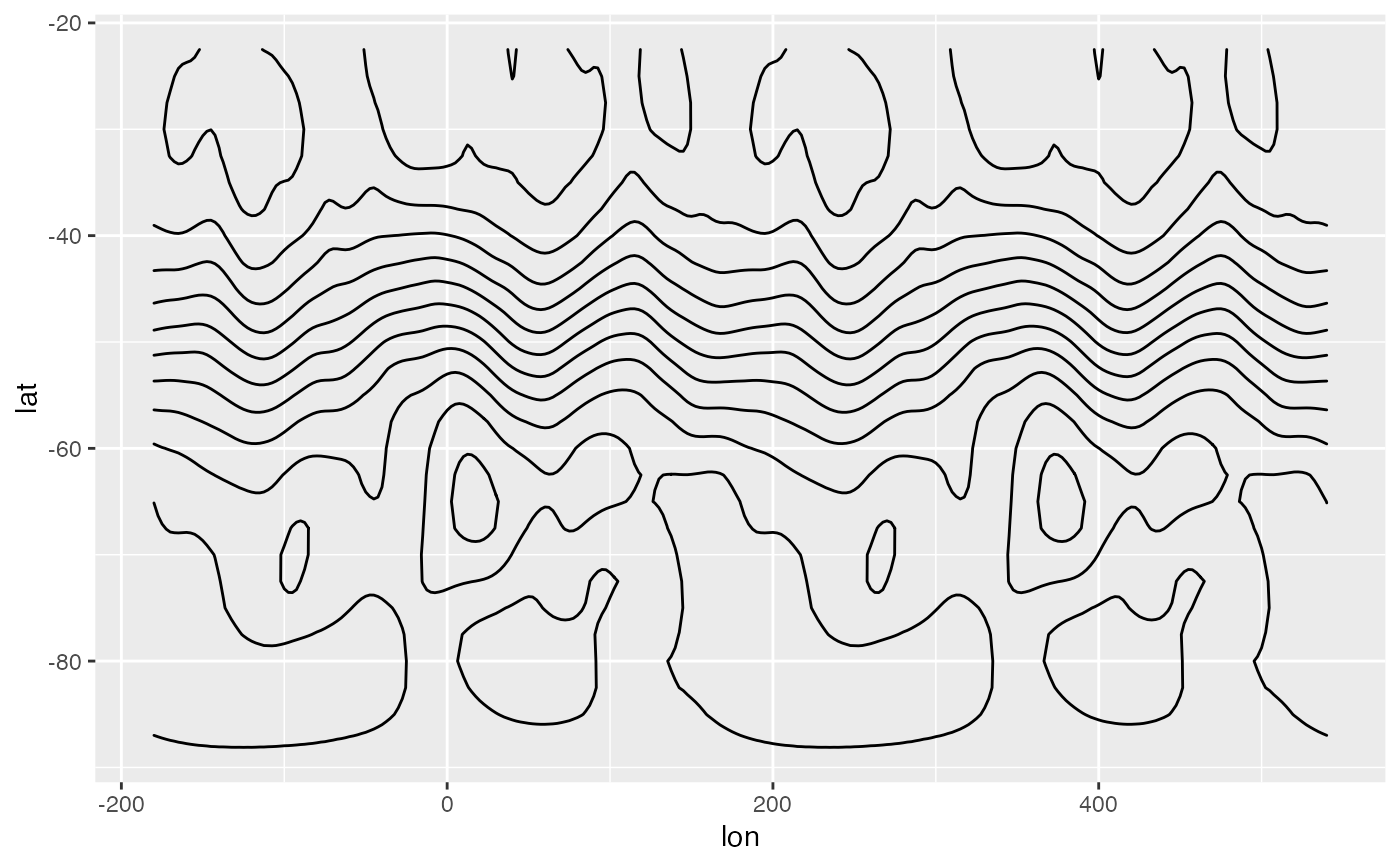
 # Aditionally data can be just repeatet to the right and
# left
ggplot(WrapCircular(geopotential[date == date[1]], wrap = c(-180, 360 + 180)),
aes(lon, lat)) +
geom_contour(aes(z = gh))
#> Warning: 'WrapCircular' is deprecated, use ggperiodic::wrap instead.
# Aditionally data can be just repeatet to the right and
# left
ggplot(WrapCircular(geopotential[date == date[1]], wrap = c(-180, 360 + 180)),
aes(lon, lat)) +
geom_contour(aes(z = gh))
#> Warning: 'WrapCircular' is deprecated, use ggperiodic::wrap instead.
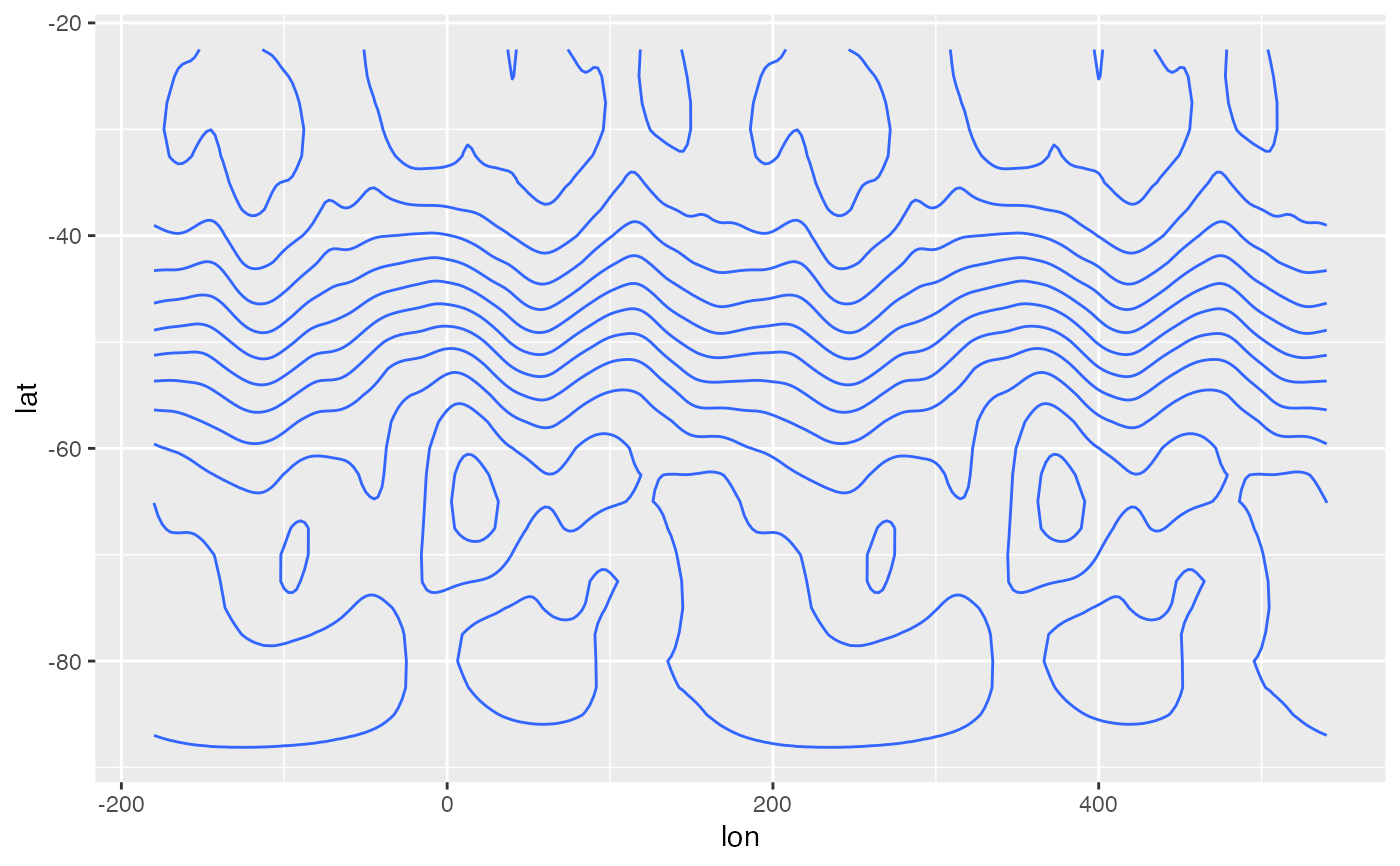 # The same behaviour is now implemented directly in geom_contour2
# and geom_contour_fill
ggplot(geopotential[date == date[1]], aes(lon, lat)) +
geom_contour2(aes(z = gh), xwrap = c(-180, 360 + 180))
#> Warning: 'xwrap' and 'ywrap' will be deprecated. Use ggperiodic::periodic insead.
# The same behaviour is now implemented directly in geom_contour2
# and geom_contour_fill
ggplot(geopotential[date == date[1]], aes(lon, lat)) +
geom_contour2(aes(z = gh), xwrap = c(-180, 360 + 180))
#> Warning: 'xwrap' and 'ywrap' will be deprecated. Use ggperiodic::periodic insead.