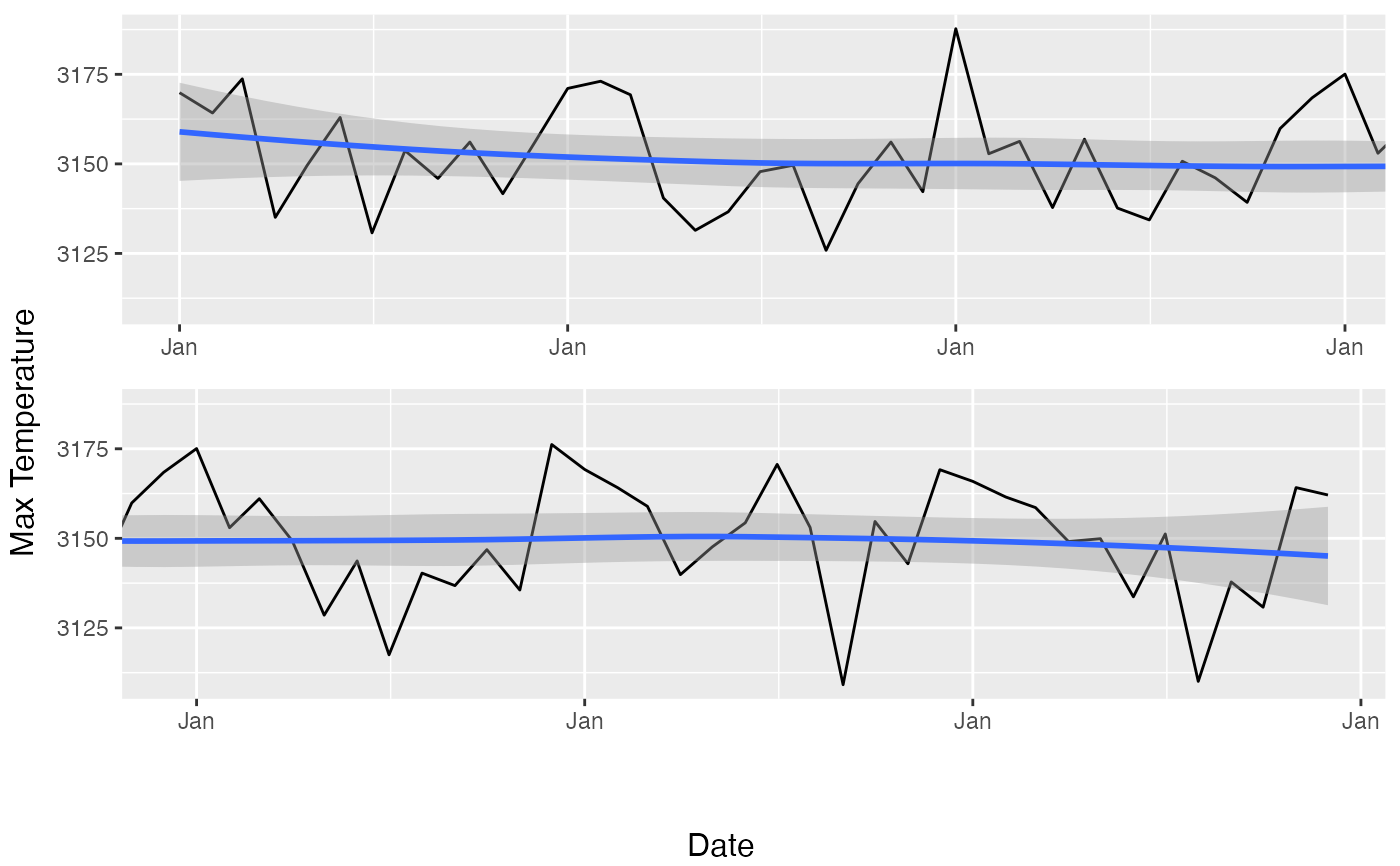
Long timeseries can be compressed to the point of being unreadable when plotted on a page. This function takes a ggplot object of a timeseries and divides it into panels so that the time dimension gets stretched for better readability.
DivideTimeseries(g, x, n = 2, xlab = "x", ylab = "y")Arguments
- g
ggplot object
- x
The vector that was used in g for the x axis (must be of class Date)
- n
Number of panels
- xlab
x axis label
- ylab
y axis label
Value
Draws a plot.
See also
Other ggplot2 helpers:
MakeBreaks(),
WrapCircular(),
geom_arrow(),
geom_contour2(),
geom_contour_fill(),
geom_label_contour(),
geom_relief(),
geom_streamline(),
guide_colourstrip(),
map_labels,
reverselog_trans(),
scale_divergent,
scale_longitude,
stat_na(),
stat_subset()
Examples
library(ggplot2)
library(data.table)
gdata <- geopotential[lat == -30 & lon == 0]
g <- ggplot(gdata, aes(date, gh)) +
    geom_line() +
    geom_smooth() +
    scale_x_date(date_breaks = "1 year", date_labels = "%b")
DivideTimeseries(g, gdata$date, n = 2, "Date", "Max Temperature")
#> Warning: 'DivideTimeseries' is deprecated, use ggwrap instead (https://github.com/wilkox/ggwrap).
#> `geom_smooth()` using method = 'loess' and formula = 'y ~ x'
#> Error in pl$grobs[[leg]] :
#>   attempt to select less than one element in get1index
#> Warning: The `<scale>` argument of `guides()` cannot be `FALSE`. Use "none" instead as
#> of ggplot2 3.3.4.
#> ℹ The deprecated feature was likely used in the metR package.
#>   Please report the issue at <https://github.com/eliocamp/metR/issues>.
#> `geom_smooth()` using method = 'loess' and formula = 'y ~ x'
#> `geom_smooth()` using method = 'loess' and formula = 'y ~ x'