Plot data and model
f.plot.RdPlot a generic graphic with observed data and predictions. Be careful to sort the data.frame beforehand.
f.plot(measures = NULL, list_legend, param, name = "", type = "Aci", ...)Arguments
- measures
Data frame obtained from CO2 or light curve with at least columns A, Ci, Qin and Tleaf.
- list_legend
Named list where the name and values will appear in the legend.
- param
List of parameters given by f.make.param().
- name
Name of the curve to be displayed
- type
Type of the curve to plot (light curve: Aq or CO2 curve Aci).
Value
Plot a figure
Examples
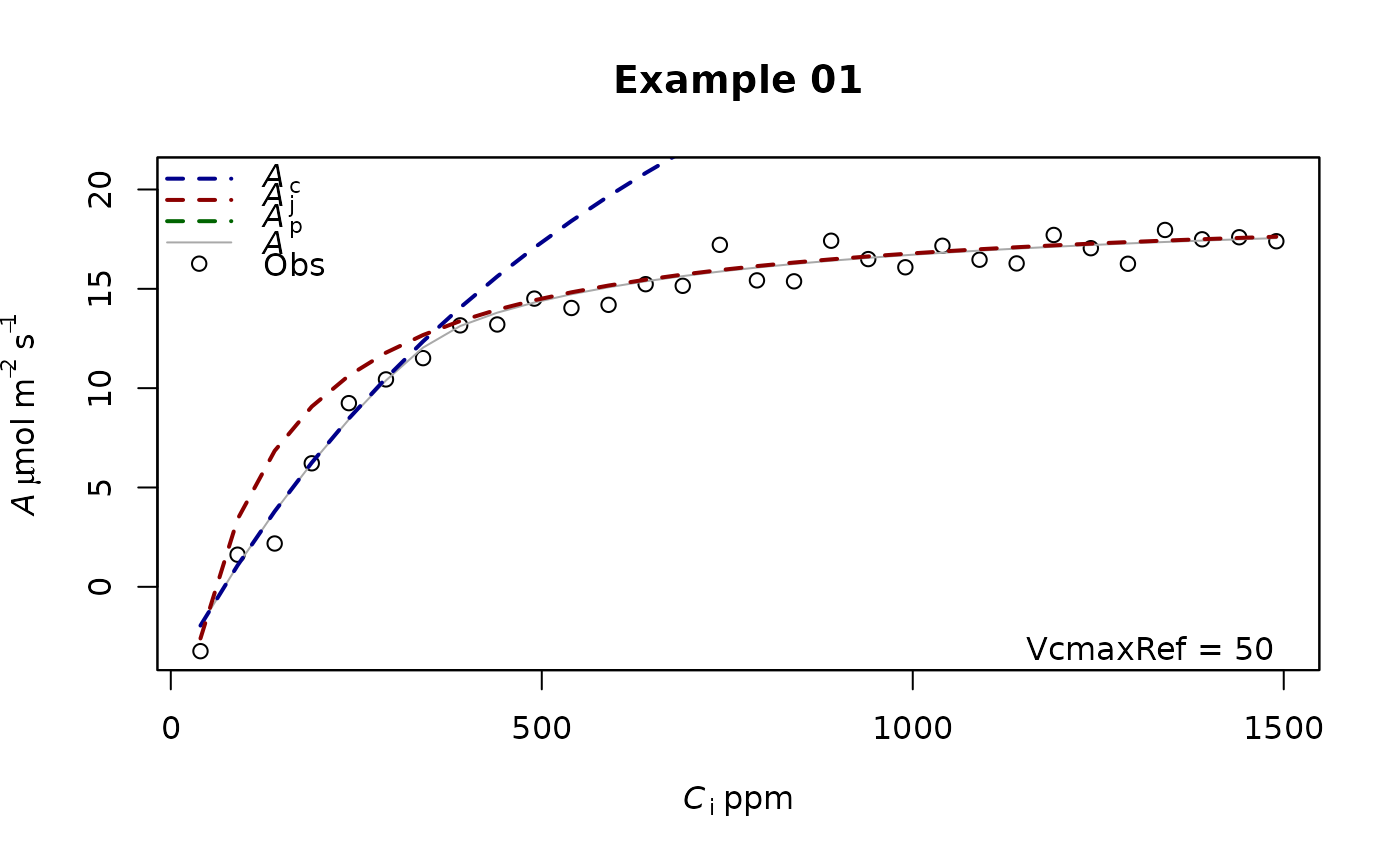
param=f.make.param()
A=f.Aci(PFD=2000,Tleaf=300,ci=seq(40,1500,50),param=param)$A+rnorm(n = 30,mean = 0,sd = 0.5)
data=data.frame(Tleaf=rep(300,30),Ci=seq(40,1500,50),Qin=rep(2000,30),A=A)
f.plot(measures=data,param=param,list_legend=param['VcmaxRef'],name='Example 01',type='Aci')